iPhone 11 plus Trump Ad Blitz equals 20% ROI LOSS
- Adsure Team
- /
- 01 Oct 2020
At a high level, Microsoft's entire digital business can be boiled down into one very simple formula, more or less described in every economics book ever made:
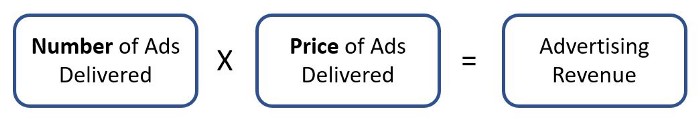
The “Number of Ads Delivered” is primarily driven by two factors:
1. The amount of engagement and number of active users on their platforms, found in Facebook’s filings. These figures are extremely predictable over time.
2. The number and frequency of ads served per view, which are completely under Facebook’s control.
These lead us to the “Price of Ads Delivered,” which includes a mixture of programmatic guaranteed (fixed) and real-time bidding (variable) pricing — both negotiated based on current rates. This is where it gets interesting…
Looking at Facebook’s public disclosures, they publish quarterly growth rates for “Number of Ads Delivered” and growth rates for “Average Price of Ads Delivered” from quarter to quarter. Adjusting for seasonality, we can see in the below table that the price demanded is extremely inelastic.
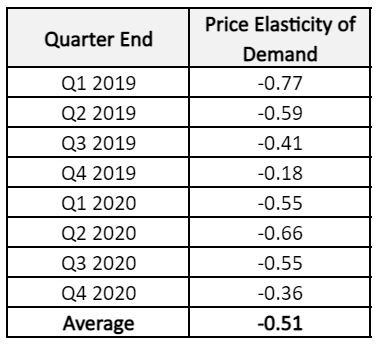
An inelastic demand (e<1) means Facebook receives outsized profits at higher prices and is heavily incentivized to encourage higher pricing.
So what does this mean for folks who haven’t read an economics book since college… basically two things:
1. Inelastic demand means that advertisers will not change the number of ads or impressions desired at the same rate as the price increase. Therefore, demand only slightly decreases when prices skyrocket. Examples of other inelastic markets include gasoline and cigarettes, where buyers really don’t (or can’t) change their purchasing decisions with price increases.
2. Facebook generates more revenue when either the number of ads served increases, or when the price increases.
The Bottom Line: Facebook is highly incentivized to encourage higher prices and higher demand.
But, there’s more…
Facebook prices experience incredible volatility as seen demonstrated by the 2 year price bands and 12 month look back diagrams below. The price volatility seen below are over twice that of the oil markets and over five times that of the US equity markets.
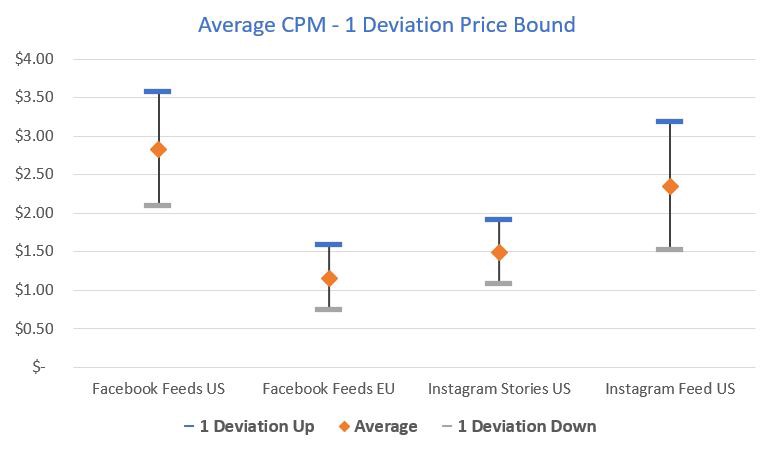
The volatility adds an important layer of complexity to the relationship. The constant price changes creates an information advantage for the players who will have a best idea for what a “fair” price is. Facebook, as the only seller, would of course have the best information which helps explain why so many advertisers choose to trust Facebook to choose the price.
| Description | Last Price | Expected Range | Weekly Change (%) | Weekly Change ($) |
|---|---|---|---|---|
| Facebook (US) - 3 Month Avg | $4.43 | $2.43 to $6.43 | 0.91% | $0.04 |
| Instagram (US) - 3 Month Avg | $3.42 | $1.42 to $5.42 | -1.44% | $-0.05 |
| Facebook (US) Weekends - 1 Month Avg | $4.53 | $2.53 to $6.53 | 2.26% | $0.10 |
| Instagram (US) Weekends - 1 Month Avg | $3.45 | $1.45 to $5.45 | 29.00% | $0.09 |
| Facebook-Instagram Basis (US) - 1 Month Avg | $1.01 | $-0.99 to $3.01 | 9.78% | $0.09 |
| Facebook United Kingdom - 1 Month Avg | $3.58 | $1.58 to $5.58 | 5.29% | $0.18 |
| Facebook Canada- 1 Month Avg | $2.33 | $0.33 to $4.33 | 3.10% | $0.07 |
| Facebook Mexico - 1 Month Avg | $0.95 | $0.71 to $1.19 | 0.00% | $0.00 |
| Facebook India - 1 Month Avg | $0.02 | $-0.18 to $0.22 | 0.00% | $0.00 |
| Facebook Australia - 1 Month Avg | $3.90 | $3.62 to $4.18 | -7.36% | $-0.31 |
| Facebook Germany - 1 Month Avg | $2.48 | $2.31 to $2.65 | -3.12% | $-0.08 |
| Facebook France - 1 Month Avg | $2.14 | $2.02 to $2.26 | 0.00% | $0.00 |
| Instagram United Kingdom - 1 Month Avg | $2.07 | $1.76 to $2.38 | 7.25% | $0.14 |
| Instagram Canada - 1 Month Avg | $1.35 | $1.24 to $1.46 | 4.65% | $0.06 |
| Instagram Mexico - 1 Month Avg | $0.55 | $0.50 to $0.60 | 1.85% | $0.01 |
| Instagram India - 1 Month Avg | $0.01 | $0.01 to $0.01 | 0.00% | $0.00 |
| Instagram Australia - 1 Month Avg | $2.25 | $2.08 to $2.42 | -5.86% | $-0.14 |
| Instagram Germany - 1 Month Avg | $1.43 | $1.33 to $1.53 | -1.38% | $-0.02 |
| Amazon Cost Per Impression | Contact us to see all results | |||
| Youtube Cost and Performance | Contact us to see all results | |||
| Google Adsense Cost Per Impression | Contact us to see all results | |||
| Google Adwords Cost Per Impression | Contact us to see all results | |||
| Cross Platform Click-Through Rate (CTR) | Contact us to see all results | |||
| Cross Platform eCPM | Contact us to see all results | |||
| Cross Platform Video Completion Rates | Contact us to see all results | |||
| Cross Platform Video Cost Per Impression | Contact us to see all results | |||
| OTT Cost and Performance | Contact us to see all results | |||
| Linkedin Cost Per Impression | Contact us to see all results | |||
| Reddit Cost Per Impression | Contact us to see all results | |||
| Microsoft Bing Cost Per Impression | Contact us to see all results | |||
| Retargeting Cluster Cost and Performance | Contact us to see all results | |||
| Industry Differential Performance Metrics | Contact us to see all results |
2023 © All Rights Reserved | Terms of Use | Privacy Policy | Check out innovative new IBD tech